
On this page
Site reliability engineering (SRE) began at Google as a way of running production with software engineers and explicit, numerical reliability targets. Its core ideas are simple to state: decide how reliable a service needs to be, measure it from the user’s point of view, treat the gap between perfect and the target as a budget that can be spent on change, and invest in automation so operational work does not grow with the system.
This article applies those ideas to services running on Azure Kubernetes Service (AKS) as of November 2024: the reliability hierarchy and where each Azure tool fits, how to define service level objectives (SLOs), how to alert on error budgets without paging people for noise, and the platform settings that set a ceiling on what any SLO can achieve. The sample code generates SLO alerting rules for Prometheus.
The reliability hierarchy
The Google SRE book describes a hierarchy of reliability needs attributed to Mikey Dickerson: monitoring at the base, then incident response, postmortems, testing and release procedures, capacity planning, development, and product at the top. Each layer depends on the ones below. A team that cannot tell when users are affected cannot respond, learn or plan.
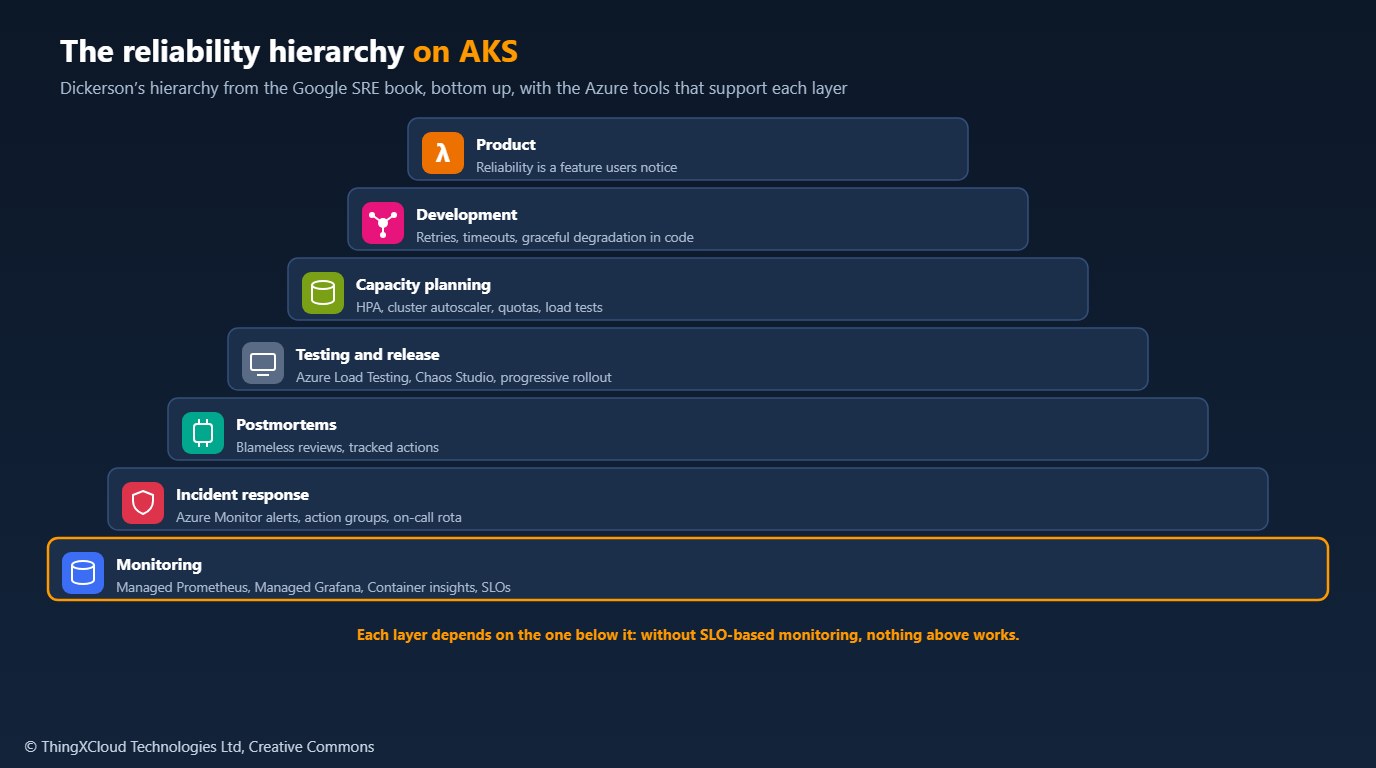
On AKS the layers map to familiar tools. Monitoring: Azure Monitor managed service for Prometheus scrapes cluster and application metrics, Azure Managed Grafana visualises them, and Container insights collects logs and node health. Incident response: Azure Monitor alert rules route through action groups to the on-call rota or an incident tool. Testing: Azure Load Testing generates realistic traffic, and Azure Chaos Studio, generally available since November 2023, injects faults, including pod and network faults on AKS through Chaos Mesh. Capacity: the Horizontal Pod Autoscaler, the cluster autoscaler and quota management.
SLIs, SLOs and error budgets
A service level indicator (SLI) is a measurement of what users experience, usually a ratio of good events to all events: requests that succeeded, requests faster than a threshold, jobs completed on time. A service level objective is a target for that ratio over a period, such as 99.9 per cent of requests succeeding over 30 days. The error budget is what the objective allows to fail: at 99.9 per cent over 30 days, 0.1 per cent of requests, or about 43 minutes of total unavailability.
Measure SLIs as close to the user as you can: at the ingress or load balancer, or from synthetic checks, rather than from CPU or pod restarts. Choose the objective from what users and the business need, not from what the system happens to achieve today, and keep it below the reliability of the things the service depends on.
%%{init: {'theme': 'base', 'themeVariables': {'primaryColor': '#FFF3E0', 'primaryTextColor': '#232F3E', 'primaryBorderColor': '#FF9900', 'lineColor': '#232F3E', 'clusterBkg': '#F8FAFC', 'clusterBorder': '#CBD5E1', 'edgeLabelBackground': '#FFFFFF', 'nodeTextColor': '#232F3E'}}}%%
flowchart TD
    A["SLO: 99.9% of requests<br/>succeed over 30 days"] --> B["Error budget:<br/>0.1% of requests"]
    B --> C{"Budget left this period?"}
    C -- "Yes" --> D["Ship features,<br/>run experiments"]
    C -- "No" --> E["Freeze risky changes,<br/>fix reliability first"]
    D --> F["Burn-rate alerts watch<br/>how fast it is spent"]
    E --> F
    F --> C
    classDef aws fill:#FFF3E0,stroke:#FF9900,stroke-width:2px,color:#232F3E
    classDef ok fill:#F0FFF4,stroke:#1D8102,stroke-width:2px,color:#145202
    classDef warn fill:#FEF2F2,stroke:#D13212,stroke-width:2px,color:#991B1B
    class A,B,C,F aws
    class D ok
    class E warn
The budget only works if it changes behaviour. Agree an error budget policy with product owners in advance: while budget remains, teams release as normal; when it is spent, risky changes pause and reliability work takes priority until the service is back within its objective.
Alert on burn rate, not on every error
Alerting when the error rate crosses a fixed line either pages for brief blips or misses a slow leak. The Google SRE Workbook recommends multiwindow, multi-burn-rate alerts instead. The burn rate is how fast the budget is being spent relative to the rate that would use exactly all of it over the period; a burn rate of 1 spends the whole 30-day budget in 30 days. The workbook’s defaults page when 2 per cent of the budget is spent in an hour (burn rate 14.4) or 5 per cent in six hours (6), and open a ticket when 10 per cent is spent in three days (1). Each alert also checks a short window, one twelfth of the long one, so it stops firing soon after the problem is fixed.
The sample generates the recording rules and the three alerts from an objective and two request counters, and reports the budget in minutes:
"""Generate Prometheus recording and alerting rules for an availability SLO.

Implements the multiwindow, multi-burn-rate alerts from the Google SRE
Workbook ("Alerting on SLOs"): each alert fires only when the error budget is
burning faster than a threshold over both a long and a short window, so it
catches real incidents quickly and clears soon after they end.

The output is a standard Prometheus rule file for self-managed Prometheus.
Azure Monitor managed service for Prometheus evaluates the same PromQL
expressions in its rule groups, which are defined as Azure resources (ARM,
Bicep or Terraform), so the expressions can be copied across.

Usage:
    python slo_rules.py --service orders-api --objective 0.999 \
        --total 'http_requests_total{job="orders-api"}' \
        --errors 'http_requests_total{job="orders-api",code=~"5.."}' > orders-slo.rules.yaml
"""
from __future__ import annotations

import argparse
import re
import sys
from dataclasses import dataclass

import yaml

# (severity, long window, short window, share of the budget consumed when the alert fires)
WORKBOOK_TIERS = [
    ("page", "1h", "5m", 0.02),
    ("page", "6h", "30m", 0.05),
    ("ticket", "3d", "6h", 0.10),
]

_UNITS = {"m": 60, "h": 3600, "d": 86400}


def seconds(window: str) -> int:
    m = re.fullmatch(r"(\d+)([mhd])", window)
    if not m:
        raise ValueError(f"bad window {window!r}; use e.g. 5m, 1h, 3d")
    return int(m.group(1)) * _UNITS[m.group(2)]


def burn_rate_threshold(budget_share: float, long_window: str, slo_period: str = "30d") -> float:
    """Burn rate at which `budget_share` of the period's budget is spent in `long_window`."""
    return round(budget_share * seconds(slo_period) / seconds(long_window), 3)


def error_budget_minutes(objective: float, slo_period: str = "30d") -> float:
    """Minutes of total unavailability the objective allows over the period."""
    if not 0 < objective < 1:
        raise ValueError("objective must be between 0 and 1, e.g. 0.999")
    return round((1 - objective) * seconds(slo_period) / 60, 2)


@dataclass
class SLO:
    service: str
    objective: float
    total: str         # selector for all requests, a counter
    errors: str        # selector for failed requests, a counter
    period: str = "30d"

    def __post_init__(self):
        if not re.fullmatch(r"[a-z0-9][a-z0-9-]*", self.service):
            raise ValueError("service must be lower-case letters, digits and hyphens")
        error_budget_minutes(self.objective, self.period)


def windows(slo: SLO) -> list[str]:
    ws = {w for _, lw, sw, _ in WORKBOOK_TIERS for w in (lw, sw)}
    return sorted(ws, key=seconds)


def recording_rules(slo: SLO) -> list[dict]:
    rules = []
    for w in windows(slo):
        rules.append({
            "record": f"slo:error_ratio:rate{w}",
            "expr": f"sum(rate({slo.errors}[{w}])) / sum(rate({slo.total}[{w}]))",
            "labels": {"service": slo.service},
        })
    return rules


def alert_rules(slo: SLO) -> list[dict]:
    budget = round(1 - slo.objective, 6)
    sel = f'{{service="{slo.service}"}}'
    rules = []
    for severity, lw, sw, share in WORKBOOK_TIERS:
        rate = burn_rate_threshold(share, lw, slo.period)
        rules.append({
            "alert": f"SLOErrorBudgetBurn{lw}",
            "expr": (f"slo:error_ratio:rate{lw}{sel} > ({rate} * {budget})\n"
                     f"and\nslo:error_ratio:rate{sw}{sel} > ({rate} * {budget})"),
            "for": "2m" if severity == "page" else "15m",
            "labels": {"severity": severity, "service": slo.service},
            "annotations": {
                "summary": f"{slo.service} is spending its error budget {rate}x too fast",
                "description": (f"Over {lw} (confirmed over {sw}) {slo.service} is failing fast enough to "
                                f"spend {share:.0%} of its {slo.period} error budget. Objective {slo.objective:.3%}."),
            },
        })
    return rules


class _Dumper(yaml.SafeDumper):
    pass


def _str(dumper, value):
    style = "|" if "\n" in value else None
    return dumper.represent_scalar("tag:yaml.org,2002:str", value, style=style)


_Dumper.add_representer(str, _str)


def rule_file(slo: SLO) -> dict:
    return {"groups": [
        {"name": f"slo-{slo.service}-recording", "interval": "1m", "rules": recording_rules(slo)},
        {"name": f"slo-{slo.service}-alerts", "rules": alert_rules(slo)},
    ]}


def main(argv: list[str]) -> int:
    ap = argparse.ArgumentParser(description=__doc__.splitlines()[0])
    ap.add_argument("--service", required=True)
    ap.add_argument("--objective", type=float, required=True)
    ap.add_argument("--total", required=True)
    ap.add_argument("--errors", required=True)
    ap.add_argument("--period", default="30d")
    a = ap.parse_args(argv)
    slo = SLO(a.service, a.objective, a.total, a.errors, a.period)
    print(f"# Error budget: {error_budget_minutes(slo.objective, slo.period)} minutes per {slo.period}",
          file=sys.stderr)
    yaml.dump(rule_file(slo), sys.stdout, Dumper=_Dumper, sort_keys=False, width=200)
    return 0


if __name__ == "__main__":
    sys.exit(main(sys.argv[1:]))
For a 99.9 per cent objective on an orders-api service the output looks like this:
groups:
- name: slo-orders-api-recording
  interval: 1m
  rules:
  - record: slo:error_ratio:rate5m
    expr: sum(rate(http_requests_total{job="orders-api",code=~"5.."}[5m])) / sum(rate(http_requests_total{job="orders-api"}[5m]))
    labels:
      service: orders-api
  - record: slo:error_ratio:rate30m
    expr: sum(rate(http_requests_total{job="orders-api",code=~"5.."}[30m])) / sum(rate(http_requests_total{job="orders-api"}[30m]))
    labels:
      service: orders-api
  - record: slo:error_ratio:rate1h
    expr: sum(rate(http_requests_total{job="orders-api",code=~"5.."}[1h])) / sum(rate(http_requests_total{job="orders-api"}[1h]))
    labels:
      service: orders-api
  - record: slo:error_ratio:rate6h
    expr: sum(rate(http_requests_total{job="orders-api",code=~"5.."}[6h])) / sum(rate(http_requests_total{job="orders-api"}[6h]))
    labels:
      service: orders-api
  - record: slo:error_ratio:rate3d
    expr: sum(rate(http_requests_total{job="orders-api",code=~"5.."}[3d])) / sum(rate(http_requests_total{job="orders-api"}[3d]))
    labels:
      service: orders-api
- name: slo-orders-api-alerts
  rules:
  - alert: SLOErrorBudgetBurn1h
    expr: |-
      slo:error_ratio:rate1h{service="orders-api"} > (14.4 * 0.001)
      and
      slo:error_ratio:rate5m{service="orders-api"} > (14.4 * 0.001)
    for: 2m
    labels:
      severity: page
      service: orders-api
    annotations:
      summary: orders-api is spending its error budget 14.4x too fast
      description: Over 1h (confirmed over 5m) orders-api is failing fast enough to spend 2% of its 30d error budget. Objective 99.900%.
  - alert: SLOErrorBudgetBurn6h
    expr: |-
      slo:error_ratio:rate6h{service="orders-api"} > (6.0 * 0.001)
      and
      slo:error_ratio:rate30m{service="orders-api"} > (6.0 * 0.001)
    for: 2m
    labels:
      severity: page
      service: orders-api
    annotations:
      summary: orders-api is spending its error budget 6.0x too fast
      description: Over 6h (confirmed over 30m) orders-api is failing fast enough to spend 5% of its 30d error budget. Objective 99.900%.
  - alert: SLOErrorBudgetBurn3d
    expr: |-
      slo:error_ratio:rate3d{service="orders-api"} > (1.0 * 0.001)
      and
      slo:error_ratio:rate6h{service="orders-api"} > (1.0 * 0.001)
    for: 15m
    labels:
      severity: ticket
      service: orders-api
    annotations:
      summary: orders-api is spending its error budget 1.0x too fast
      description: Over 3d (confirmed over 6h) orders-api is failing fast enough to spend 10% of its 30d error budget. Objective 99.900%.
The file loads directly into a self-managed Prometheus. Azure Monitor managed service for Prometheus evaluates the same PromQL in rule groups that are defined as Azure resources, so the expressions can be copied into Bicep, ARM or Terraform definitions and deployed with the rest of the platform.
Page people for SLO burn, which means users are affected. Send high CPU, a restarting pod or a node under memory pressure to dashboards or tickets: they matter, but often affect no one, and paging on them trains people to ignore pages.
Set the platform ceiling
No SLO can exceed the reliability of the platform underneath it, so the cluster configuration comes first.
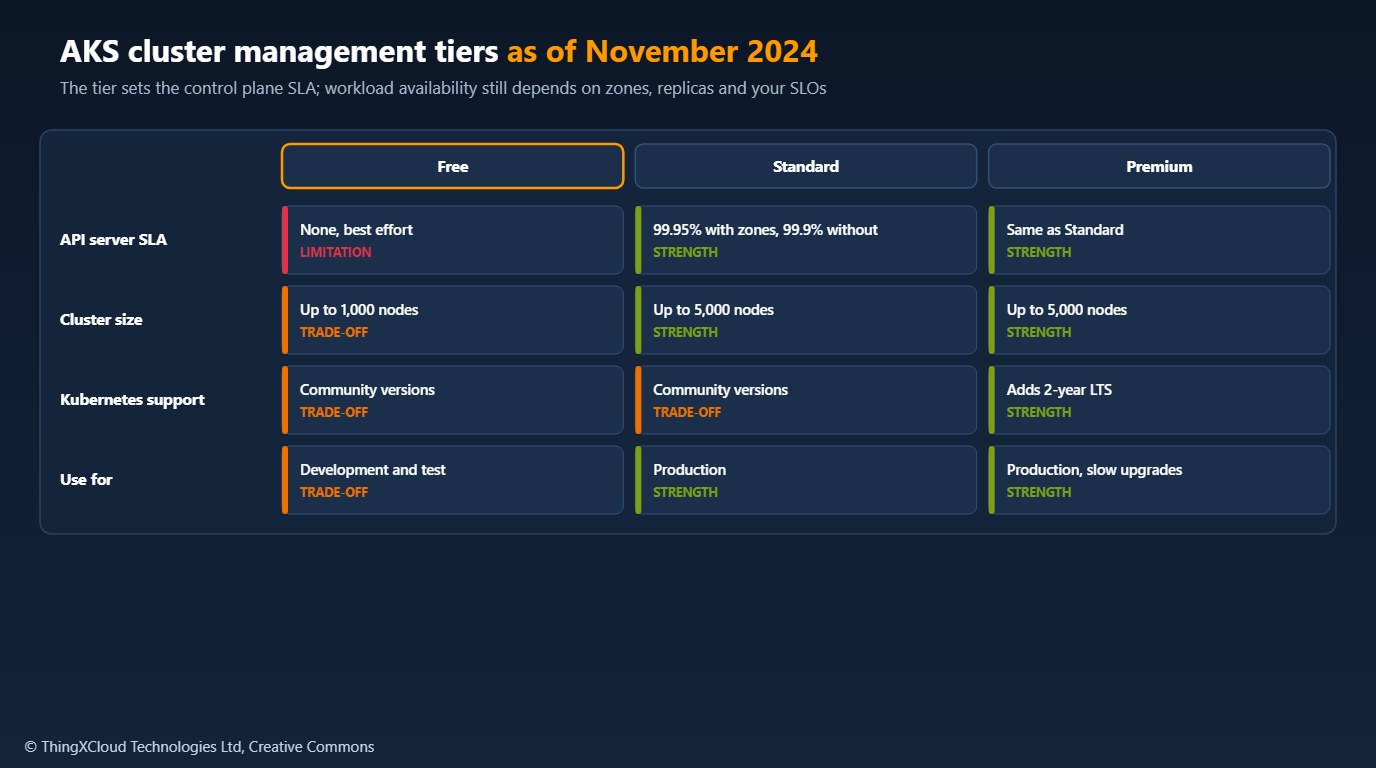
- Cluster tier. The Standard and Premium tiers include a financially backed uptime SLA for the Kubernetes API server: 99.95 per cent with availability zones, 99.9 per cent without. The Free tier has none. Premium adds two-year long-term support for selected Kubernetes versions.
- Availability zones. Spread node pools across zones and use zone-redundant storage and load balancers, so the loss of one datacentre does not take the service down.
- Workload resilience. At least one replica per zone, topology spread constraints, PodDisruptionBudgets so upgrades and node drains keep enough replicas running, and readiness and liveness probes that reflect real health.
- Upgrades. Use planned maintenance windows, node surge settings and auto-upgrade channels so version changes happen predictably rather than as emergencies when a version leaves support.
- Dependencies. Databases, caches and external APIs have their own SLAs. The composite availability of a request that needs all of them is lower than any one of them.
The AKS uptime SLA covers the Kubernetes API server. Running pods keep serving traffic during a brief API server outage, and a healthy API server does not mean your service is up. Your users’ experience is measured by your SLIs, not by the platform SLA.
Keep alert history, incident timelines and postmortems where they can be retrieved for audits and regulatory reporting. In regulated sectors, outages of important services may have reporting deadlines, so record when an incident started affecting users, not only when it was detected.
slo_rules.py was tested with Python 3.12, pyyaml==6.0.2, promql-parser==0.4.1 and pytest==8.3.3: fifteen tests cover the workbook burn rates for 30 and 28 days, error budget minutes, parsing of every generated expression with a PromQL parser, window coverage, CLI output and input validation. example.rules.yaml is the script’s output. The rules were not loaded into a live Prometheus or Azure Monitor workspace.
Key takeaways
- Build reliability from the bottom of the hierarchy: monitoring that sees what users see comes first.
- Define SLIs as good events over all events, close to the user, and set SLOs from what users need.
- Agree an error budget policy before you need it, so a spent budget changes priorities.
- Alert on multiwindow burn rates; page for user impact, ticket for causes.
- Use Standard or Premium tier, zones, replicas per zone and PodDisruptionBudgets: the platform sets the ceiling for every SLO.
How have SLOs and error budgets changed the way your teams decide what to work on? Share it in the comments.
The complete sample for this article is on GitHub: nithinmohantk/blog-samples-working-repo/slo-burn-rate-rules. Clone it with git clone https://github.com/nithinmohantk/blog-samples-working-repo.git and open the slo-burn-rate-rules folder. Its README says how to run it and what has been verified.
Glossary
- SRE
- Site reliability engineering: running production with software engineering practices and explicit reliability targets.
- SLI
- Service level indicator: a measured ratio of good events to all events.
- SLO
- Service level objective: a target for an SLI over a period.
- Error budget
- The share of events an SLO allows to fail in its period.
- Burn rate
- How fast the error budget is being spent relative to spending exactly all of it over the period.
- Error budget policy
- An agreement on what changes when the budget is spent.
- PodDisruptionBudget
- A Kubernetes object that limits how many replicas voluntary disruptions may take down at once.
References & Further Reading
- → Alerting on SLOs— Google SRE Workbook: multiwindow, multi-burn-rate alerts
- → AKS Free, Standard and Premium pricing tiers— Uptime SLA terms and tier differences
- → Azure Chaos Studio is now generally available— November 2023
- → Sample code for this article— SLO recording and burn-rate alert rule generator
Discover more from C4: Container, Code, Cloud & Context
Subscribe to get the latest posts sent to your email.
