After two decades of managing containerized workloads across production environments, I’ve come to appreciate that the difference between a good Kubernetes deployment and a great one often comes down to how intelligently it responds to changing demand. Horizontal Pod Autoscaling (HPA) represents one of those fundamental capabilities that separates reactive operations from proactive infrastructure management.

Understanding the Scaling Landscape
Before diving into HPA specifics, it’s worth understanding where it fits in the broader Kubernetes scaling ecosystem. Kubernetes provides three primary scaling mechanisms: Horizontal Pod Autoscaling (adding or removing pod replicas), Vertical Pod Autoscaling (adjusting resource requests and limits), and Cluster Autoscaling (adding or removing nodes). Each serves a distinct purpose, and in production environments, I typically implement all three in concert.
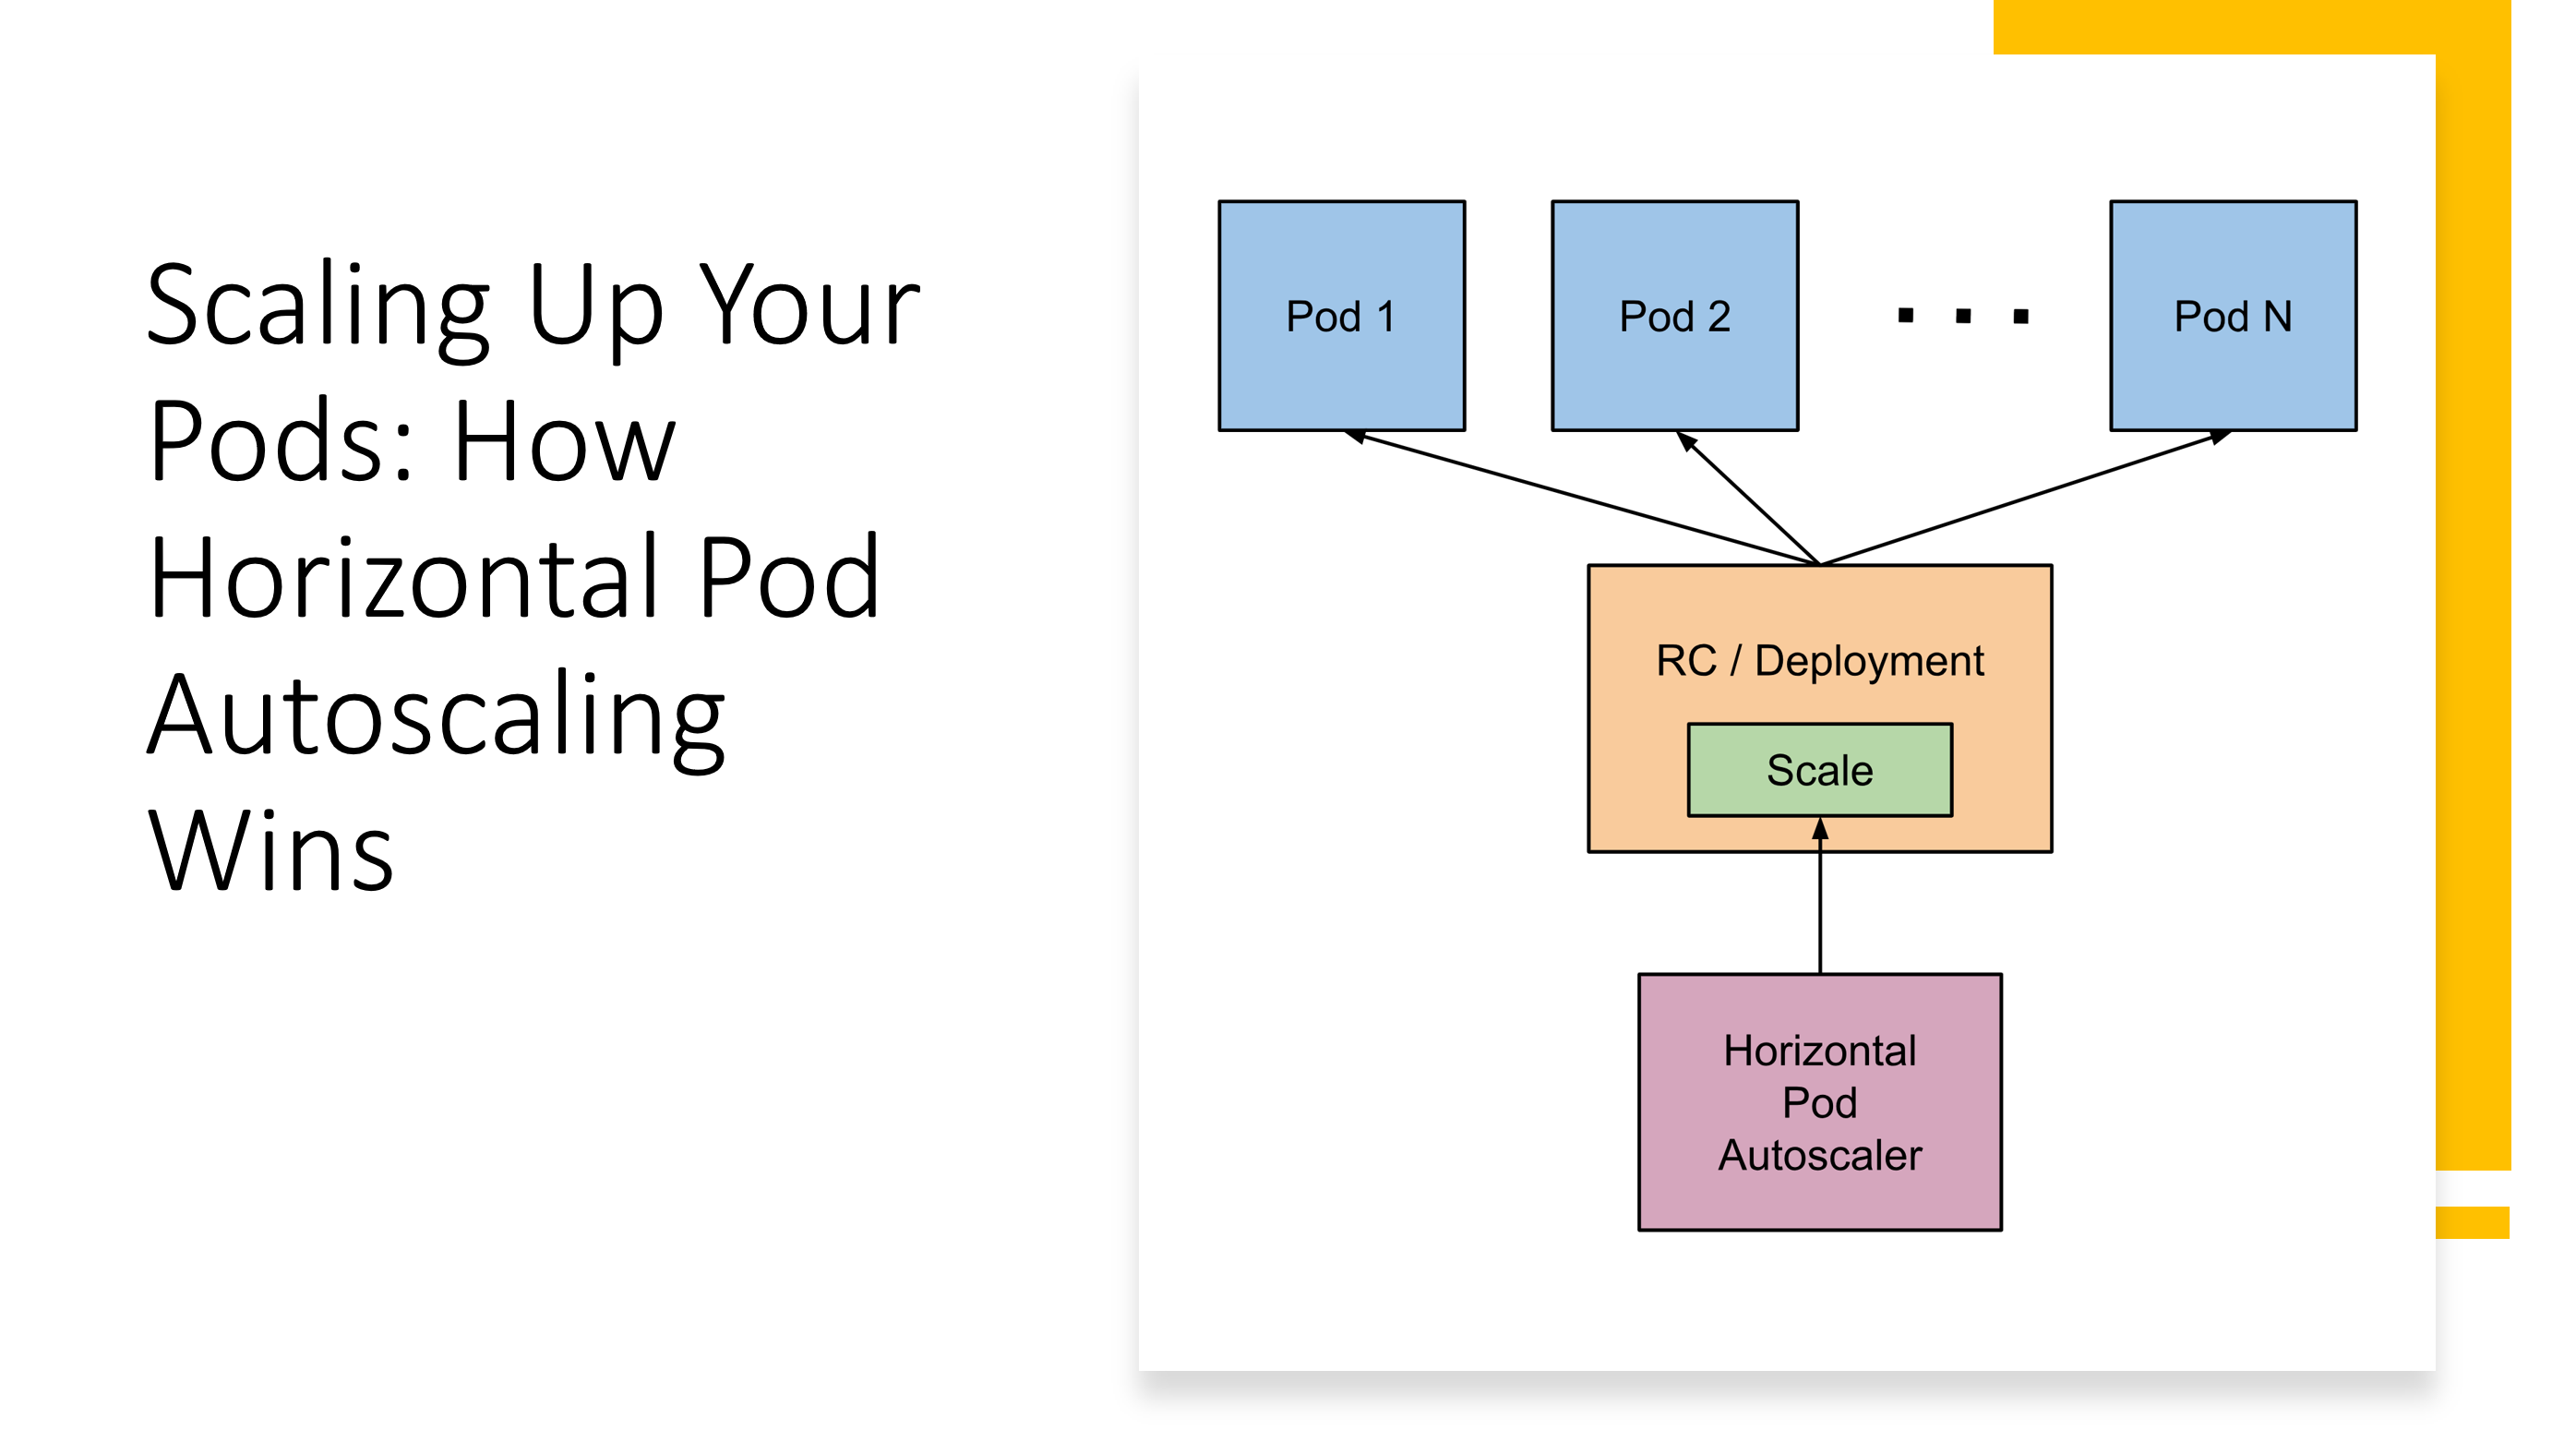
HPA specifically addresses the challenge of maintaining application performance under variable load by automatically adjusting the number of pod replicas. Unlike static replica sets that maintain a fixed count regardless of actual demand, HPA continuously monitors metrics and makes intelligent scaling decisions based on real-time conditions.
The Mechanics of Horizontal Pod Autoscaling
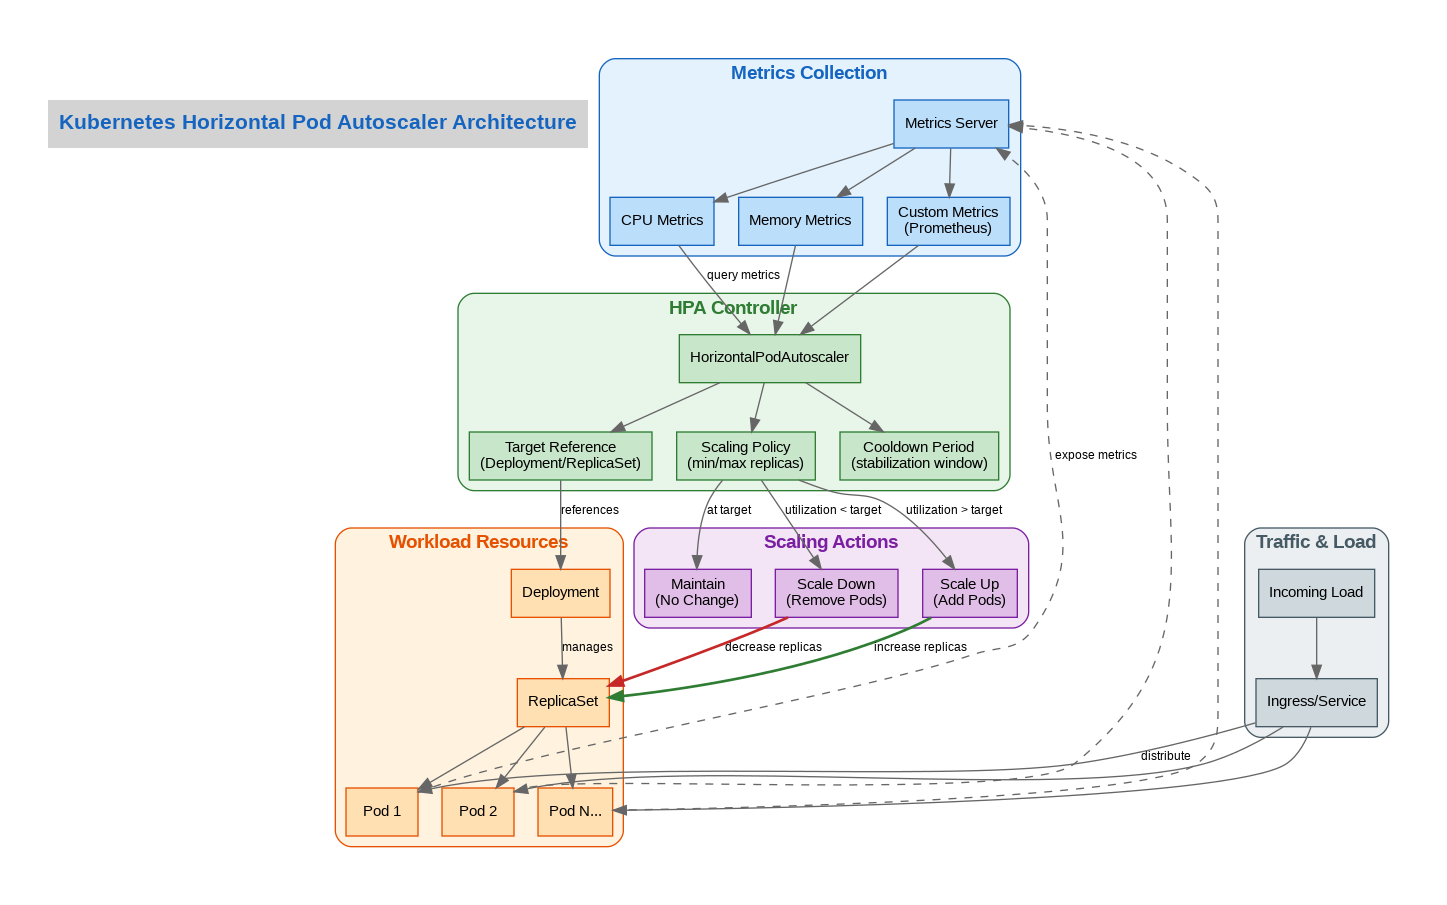
At its core, HPA operates through a control loop that runs every 15 seconds by default. The HPA controller queries the metrics API, calculates the desired replica count based on current metric values versus target thresholds, and then updates the target workload’s replica count accordingly. This seemingly simple process involves sophisticated algorithms to prevent oscillation and ensure stable scaling behavior.
The scaling algorithm uses the formula: desiredReplicas = ceil[currentReplicas * (currentMetricValue / desiredMetricValue)]. However, the actual implementation includes tolerance windows, stabilization periods, and rate limiting to prevent thrashing. Understanding these nuances is crucial for production deployments.
Metrics: The Foundation of Intelligent Scaling
HPA supports three categories of metrics, each serving different use cases. Resource metrics (CPU and memory utilization) are the most common and are provided by the metrics-server. These work well for compute-bound workloads but can be misleading for I/O-bound or network-bound applications.
Custom metrics, exposed through the custom.metrics.k8s.io API, allow scaling based on application-specific indicators like queue depth, active connections, or request latency. In my experience, custom metrics often provide more meaningful scaling signals than raw resource utilization.
External metrics enable scaling based on metrics from outside the cluster, such as cloud provider queue lengths or external monitoring systems. This capability is particularly valuable in hybrid architectures where workload drivers exist outside Kubernetes.
Production Configuration Best Practices
Through years of production experience, I’ve developed several configuration patterns that consistently deliver reliable autoscaling behavior. First, always set appropriate resource requests on your pods. HPA’s CPU-based scaling relies on comparing actual usage against requested resources, so accurate requests are essential for meaningful scaling decisions.
Second, configure stabilization windows appropriately. The default scale-down stabilization of 300 seconds prevents premature scale-down during temporary load decreases, but this may need adjustment based on your application’s traffic patterns. For applications with highly variable traffic, I often extend this to 600 seconds or more.
Third, implement scaling policies that match your application’s characteristics. The behavior field in HPA v2 allows fine-grained control over scaling velocity, enabling different policies for scale-up versus scale-down operations.
Real-World Implementation Example
Here’s a production-ready HPA configuration that I’ve used successfully across multiple deployments:
apiVersion: autoscaling/v2
kind: HorizontalPodAutoscaler
metadata:
  name: web-app-hpa
spec:
  scaleTargetRef:
    apiVersion: apps/v1
    kind: Deployment
    name: web-app
  minReplicas: 3
  maxReplicas: 50
  metrics:
  - type: Resource
    resource:
      name: cpu
      target:
        type: Utilization
        averageUtilization: 70
  - type: Resource
    resource:
      name: memory
      target:
        type: Utilization
        averageUtilization: 80
  behavior:
    scaleDown:
      stabilizationWindowSeconds: 300
      policies:
      - type: Percent
        value: 10
        periodSeconds: 60
    scaleUp:
      stabilizationWindowSeconds: 0
      policies:
      - type: Percent
        value: 100
        periodSeconds: 15
      - type: Pods
        value: 4
        periodSeconds: 15
      selectPolicy: Max
This configuration targets 70% CPU utilization and 80% memory utilization, with aggressive scale-up behavior (doubling capacity every 15 seconds if needed) and conservative scale-down (maximum 10% reduction per minute). The minimum of 3 replicas ensures high availability, while the maximum of 50 provides headroom for traffic spikes.
Common Pitfalls and How to Avoid Them
One of the most common mistakes I see is setting CPU targets too low, causing constant scaling oscillation. A target of 50% might seem conservative, but it often leads to unnecessary scale-up events followed by scale-down, wasting resources and potentially causing application instability.
Another frequent issue is neglecting to account for pod startup time. If your application takes 60 seconds to become ready, but traffic spikes occur faster than that, you’ll experience degraded performance despite HPA working correctly. Consider implementing pod readiness probes and potentially using KEDA for more sophisticated scaling triggers.
Finally, don’t forget about cluster capacity. HPA can request more replicas, but if the cluster lacks resources to schedule them, scaling fails silently. Always pair HPA with Cluster Autoscaler in cloud environments to ensure infrastructure can grow alongside application demand.
The Road Ahead
As Kubernetes continues to evolve, HPA capabilities are expanding. The integration with KEDA (Kubernetes Event-Driven Autoscaling) provides even more sophisticated scaling triggers, while predictive autoscaling based on machine learning models is emerging as a powerful complement to reactive scaling.
For teams beginning their autoscaling journey, I recommend starting with simple CPU-based HPA, monitoring behavior carefully, and gradually introducing custom metrics as you understand your application’s scaling characteristics. The goal isn’t just to scale automatically—it’s to scale intelligently, maintaining performance while optimizing resource utilization and cost.
References
Discover more from C4: Container, Code, Cloud & Context
Subscribe to get the latest posts sent to your email.
