With the release of Windows 8.1 Preview – Microsoft has released the Internet Explorer 11 (PREVIEW) which includes a new developer tools for Windows.
How to open Developer Tool in IE11? After opening IE11 – press F12 key – this invoke developer tool bar in IE.
F12 Developer Tool bar was existing since the earlier version of Internet Explorer, but with IE11 – Microsoft has revamped the entire feeling and introduced new set of features for developers as well.
There are mainly eight tools now, as tabs in the F12 tools interface. Which includes the following:
1. DOM Explorer Tool
[Quoting from: MSDN]
The The DOM Explorer tool shows the structure of your webpage as it’s being rendered in the browser and makes it possible to edit your HTML and styles in a live page. You can do this without having to edit and reload your sources, so you can quickly solve display issues or experiment with new ideas.
New features in the DOM Explorer tool include:
- IntelliSense autocompletion suggestions when editing HTML attributes and CSS properties.
- Drag DOM nodes to rearrange them.
2. The Console Tool
[Quoting from: MSDN]
The Console tool provides a way to interact with your running code, sending info in with the Console’s command line and getting info out using the Console Debugging API. The Console tool is considered to be so useful by developers, we’ve made it easier to get to. You can now open it at the bottom of any other tool using the Console button in the upper-right of the UI, next to the Help button or CTRL + `.
New features in the Console tool include:
- Open the Console at the bottom of any other tool with the Console button or CTRL + `.
- New Console Debugging API methods for timing, counting, grouping, and more.
- IntelliSense autocompletion suggestions on the command line speed up input, reduce typos, and help you discover aspects of JavaScript APIs.
3. The debugger tool
[Quoting from: MSDN]
You use the Debugger tool to examine what your code is doing, when it’s doing it, and how it’s doing it. Pause code in mid-execution, step through it line-by-line, and watch the state of variables and objects at each step.
New features in the Debugger tool include:
- No-refresh debugging. Set your breakpoints and go without reloading and losing state.
- Tabbed document interface for easier management of multiple scripts.
- Scrollbar that highlights breakpoints and search matches.
4. The Network Tool
The Network tool gives you the fine details of any network requests involved in the loading and operation of your webpages.
New features in the Network tool include:
- Improved request timing info.
- Improved capture of compression info.
5. The UI Responsiveness Tool (NEW)
[Quoting from: MSDN]

[Image Courtesy: MSDN, Microsoft]
The UI responsiveness tool helps you dig into what is happening when your page slows down. Using it to profile specific points of slowness shows the operations that are causing them.
The UI responsiveness tool is new to F12 tools in IE11 Preview. Some interesting features are:
- Identifying the different sources of CPU activity causing UI slowness.
- Insight into your webpage’s frame rate.
- Setting labels on the timeline to isolate user scenarios.
Development and debugging tasks it makes easier:
- Testing code optimizations.
- Speeding up your webpages.
6. The Profiler Tool
[Quoting from: MSDN]
The Profiler tool is pure JavaScript speed measurement, showing you the functions that were called during a profiling session, how many times they were called, and how long they took to complete.
New features in the Profiler tool include:
- Tracking which functions were executed in web workers.
- Cleaner, more responsive UI.
7. The Memory Tool (NEW)
[Quoting from: MSDN]

[Image Courtesy: MSDN, Microsoft]
The Memory tool is new to F12 tools in IE11 Preview. Some interesting features are:
- A timeline to see progressive changes in memory use.
- Snapshots to examine the details of memory use at specific points.
- Snapshot comparisons to identify specific points of growth.
Development and debugging tasks it makes easier:
- Identifying detached DOM nodes.
- Identifying points of memory growth.
- Measuring the memory use of objects.
Learn more about the Memory tool. [Ref: MSDN]
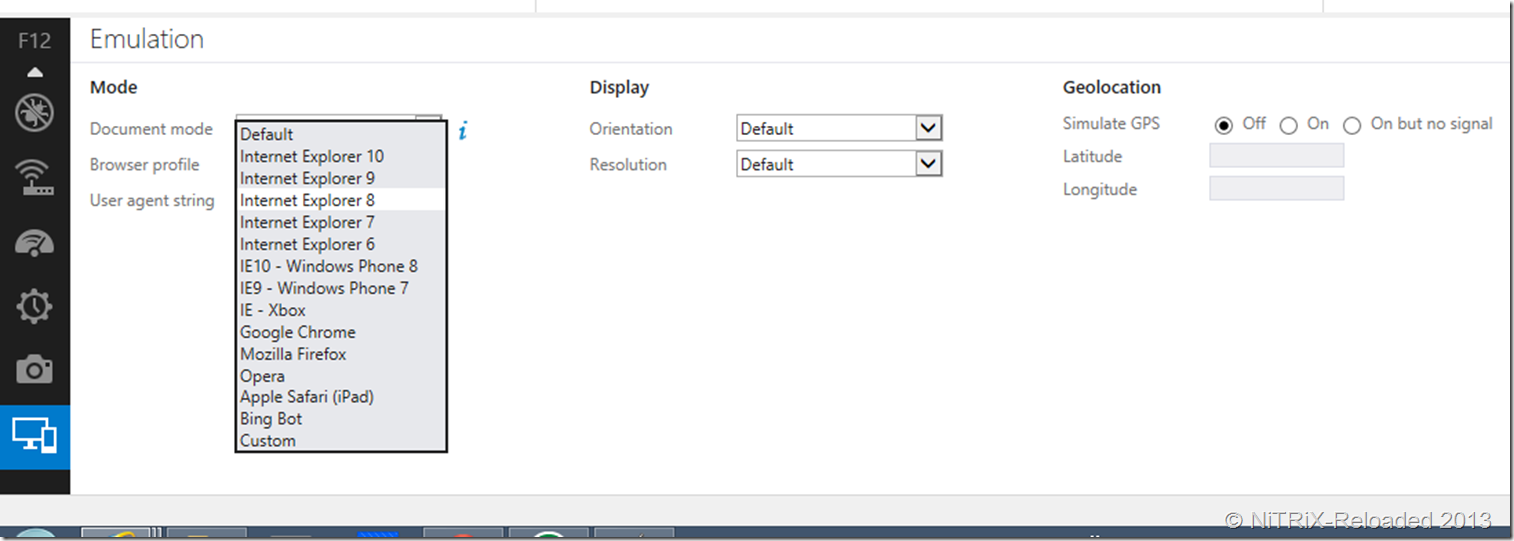
8. The Emulator Tool (NEW)
[Quoting from: MSDN]
The Emulation tool helps you test how your webpages run on different screen sizes and hardware features, and how they respond to different user agent strings.
The Emulation tool is new to F12 tools in IE11 Preview. Some interesting features are:
- You can emulate different screen sizes and resolutions.
- GPS simulation.
Development and debugging tasks it makes easier:
- Testing responsive designs on multiple screen types.
- Testing location-aware features for a mobile site.
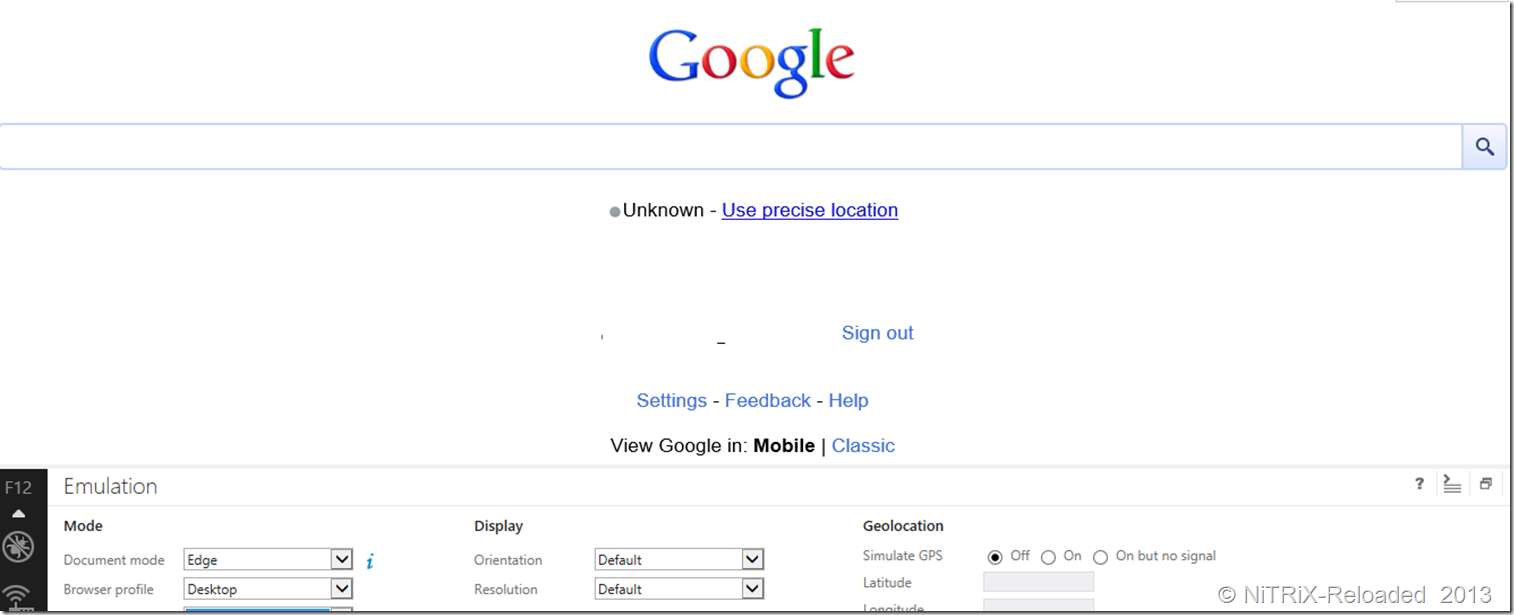
Google.com – mobile web ( Emulating IE-Mobile 10 in IE11)
It is really interesting how Microsoft visualized the needs of any web developer and made these tools for us.
See more from following links:
What’s new in F12 developer tools
Courtesy: MSDN
Discover more from C4: Container, Code, Cloud & Context
Subscribe to get the latest posts sent to your email.

